
I ran some numbers on the whole Real Clear Politics Republican Nominee 2016 dataset. This chart shows how much one candidate’s number move in accordance with each other candidates. Technically, it shows each answer twice, but that makes it possible to read each of the left-to-right, instead of some triangle arrangement.
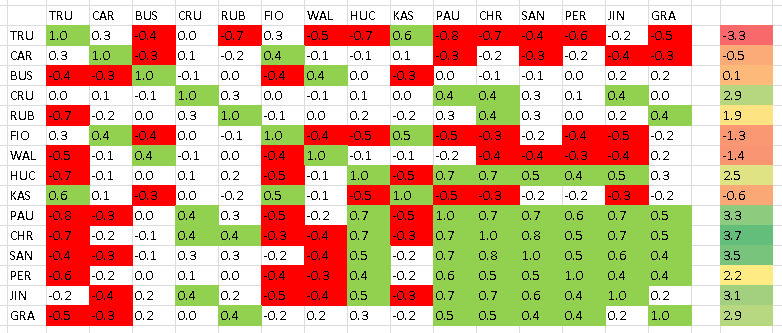
The unlabeled column on the right is the sum of all the numbers in that row. That makes it an indicator of how much a candidate’s movements tend to align with the movement of others. That big green block largely moves together. The few long red streaks are candidates who move opposite a large number of others.
More to follow.
What do you mean by “number move”?
Rubio and Cruz don’t move. Does this mean they stay on topic/with their ideas or that only the same people are paying attention to them?
Howdy! This is a measure of the pairwise correlation between candidates’ poll results.
Each square has a score from -1 to +1 describing how similar two candidates polling numbers move over time. So Trump’s poll results typically move somewhat in sync with Kasich. naturally, his numbers move 100% in sync with himself, so at the intersection of Trump and Trump, there’s a +1. Trump and Rubio tend to move out of sync: when one goes up in the polls, the other goes down.
There are several problems with this, so it is inaccurate beyond a first approximation. For one, the RCP numbers do not add up to 100 on each polled date, so there’s guaranteed slop in there, which should make lower-polling candidates scores less reliable — bad signal-to-noise ratio. Another issue is that the complete performance of each candidate is compared, so those who have been polled as “candidates” since 2014 like Bush, Rubio, Christie and Paul will have a different responses to recent movements than the relative newcomers such as Trump, Fiorina, Kasich, and Graham. but that may be a feature, not a bug, and I could control for it with come weighting factor, or by cutting off all results before, say, six months ago. But that’s another graph…
Well, not understanding what it is you are doing here, my sense is that from the colours the ones in green move together, while the ones in red move against the grain.
Yup.
As ever, Dev, you cut to the heart of the matter…Thanks for bailing out my graphi-numerically-challenged self!
(Beloved Admin, when you’re ready to burn down the house, I’ll bring the franks, chocolate/graham crackers/marshmallows ,just sayin’…)